Pandemic-fuelled factors are driving property seekers to suburbs and city outskirts, expert says
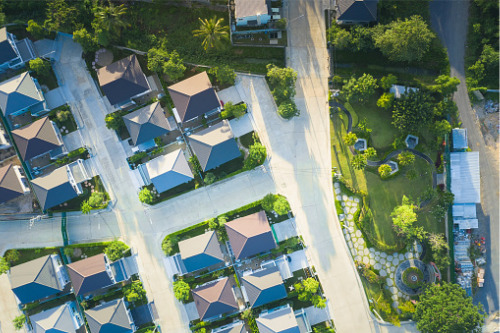
Australia’s property market has been experiencing a marked rise in buyer interest, triggered by a range of pandemic-fuelled factors – but a shift in buyer preferences has pushed demand away from the inner cities to the suburbs and city outskirts, recent data has shown.
“Low borrowing costs, restrictions on travel, and the ability to work remotely have probably been the three biggest factors in driving this surge,” said Cameron Kusher, director of economic research at Realestate.com.au.
The property market intelligence website recently developed a metric that tracks the number of “highly engaged” buyers searching for properties in specific suburbs. This has allowed the company to paint an accurate picture of housing demand in an area.
The website described a highly engaged buyer as someone who is likely to make a home purchase based on their online activity, including “returning to a listing multiple times, looking at floorplans, emailing or calling the agent, and scheduling an appointment.”
Data gathered by Realestate.com.au in the 12 months ending in February showed a strong buyer preference for “lifestyle factors” – such as larger spaces and seaside living – which Kusher said was a “COVID-effect.”
“Demand has shifted to outer and near capital city markets over the past year as people are much more interested in lifestyle and space as opposed to historically, where the focus has been proximity to work,” he said. “With flexible working arrangements, meaning people don’t have to be in the office every day, demand has shifted to these areas.”
Australia’s property hotspots for 2021
Data showed that Buderim on Queensland’s Sunshine Coast was the most sought-after suburb for houses in the country, with 42,239 highly engaged buyers hunting for properties there. It was followed by Melbourne’s Berwick, and Sydney’s Kellyville, with 41,481 and 37,371 serious property seekers, respectively.
Half of Australia’s top 10 most in-demand suburbs were in Victoria’s Mornington Peninsula region, with Mount Martha (34,874), Frankston (34,355), Mount Eliza (32,084), Mornington (31,843), and Rye (31,305) securing the fourth to eight spots.
In contrast, demand for units was stronger in inner-city suburbs, which Kusher noted was primarily influenced by supply.
“A lot of outer capital city and regional markets don’t actually have a substantial supply of units, they are only located in specific locations of the country so that is why we are seeing stronger demand in these areas,” he said.
Melbourne, with 51,787 serious buyers, was the most popular suburb for apartment units nationally, followed by Surfers Paradise with 40,938. The coastal town in Queensland’s Gold Coast was the only non-capital city market to make the top 10. South Yarra (38,236), St Kilda (35,596), and Richmond (31,423), all in Victoria, rounded up the top five.
Here is a state-by-state breakdown of Australia’s most in-demand suburbs based on Realestate.com.au’s metric.
Victoria
|
Houses |
|||||
|---|---|---|---|---|---|
|
Suburb |
Highly engaged buyers |
YoY growth |
Buyer type |
||
|
Subsequent buyers |
First home buyers |
Investors |
|||
|
Berwick |
41,481 |
53.0% |
46% |
41% |
13% |
|
Mount Martha |
34,874 |
47.4% |
75% |
12% |
13% |
|
Frankston |
34,355 |
44.7% |
38% |
43% |
18% |
|
Mount Eliza |
32,084 |
53.6% |
84% |
7% |
9% |
|
Mornington |
31,843 |
57.5% |
62% |
24% |
14% |
|
Rye |
31,105 |
58.9% |
64% |
9% |
26% |
|
Kew |
30,905 |
36.5% |
74% |
12% |
14% |
|
Croydon |
30,501 |
31.3% |
40% |
48% |
12% |
|
Brighton |
30,044 |
35.5% |
79% |
6% |
15% |
|
Pakenham |
29,951 |
39.2% |
33% |
50% |
17% |
Source: Realestate.com.au
|
Units |
|||||
|---|---|---|---|---|---|
|
Suburb |
Highly engaged buyers |
YoY growth |
Buyer type |
||
|
Subsequent buyers |
First home buyers |
Investors |
|||
|
Melbourne |
51,787 |
14.1% |
40% |
34% |
26% |
|
South Yarra |
38,288 |
30.2% |
38% |
47% |
16% |
|
St Kilda |
35,596 |
32.0% |
33% |
52% |
15% |
|
Richmond |
31,423 |
17.8% |
32% |
53% |
15% |
|
Hawthorn |
27,503 |
18.6% |
32% |
50% |
18% |
|
Elwood |
26,273 |
45.7% |
38% |
48% |
14% |
|
Southbank |
25,848 |
32.0% |
40% |
41% |
19% |
|
Northcote |
23,830 |
34.0% |
30% |
60% |
10% |
|
Carnegie |
23,849 |
26.9% |
29% |
60% |
11% |
|
Preston |
23,536 |
27.4% |
26% |
65% |
9% |
Source: Realestate.com.au
New South Wales
|
Houses |
|||||
|---|---|---|---|---|---|
|
Suburb |
Highly engaged buyers |
YoY growth |
Buyer type |
||
|
Subsequent buyers |
First home buyers |
Investors |
|||
|
Kellyville |
37,371 |
39.7% |
63% |
29% |
8% |
|
Castle Hill |
30,017 |
34.3% |
70% |
18% |
12% |
|
Baulkham Hills |
25,789 |
22.8% |
59% |
29% |
13% |
|
Blacktown |
24,410 |
48.4% |
34% |
45% |
21% |
|
Port Macquarie |
21,447 |
43.7% |
59% |
19% |
22% |
|
Mosman |
20,869 |
29.6% |
85% |
5% |
10% |
|
West Pennant Hills |
20,206 |
56.7% |
77% |
14% |
9% |
|
Quakers Hill |
19,267 |
47.7% |
34% |
55% |
11% |
|
Banora Point |
19,167 |
47.6% |
57% |
29% |
14% |
|
Terrigal |
18,985 |
69.4% |
67% |
14% |
19% |
Source: Realestate.com.au
|
Units |
|||||
|---|---|---|---|---|---|
|
Suburb |
Highly engaged buyers |
YoY growth |
Buyer type |
||
|
Subsequent buyers |
First home buyers |
Investors |
|||
|
Mosman |
17,754 |
44.7% |
54% |
26% |
20% |
|
Randwick |
16,541 |
39.4% |
43% |
41% |
16% |
|
Wollongong |
15,969 |
53.8% |
35% |
38% |
27% |
|
Sydney |
15,767 |
31.2% |
55% |
17% |
28% |
|
Dee Why |
15,673 |
23.1% |
42% |
41% |
17% |
|
Surry Hills |
15,647 |
34.1% |
47% |
34% |
19% |
|
Neutral Bay |
15,621 |
33.4% |
52% |
28% |
20% |
|
Ryde |
14,977 |
30.0% |
38% |
52% |
10% |
|
Manly |
14,344 |
51.5% |
53% |
16% |
31% |
|
Cronulla |
13,920 |
45.6% |
47% |
30% |
23% |
Source: Realestate.com.au
Queensland
|
Houses |
|||||
|---|---|---|---|---|---|
|
Suburb |
Highly engaged buyers |
YoY growth |
Buyer type |
||
|
Subsequent buyers |
First home buyers |
Investors |
|||
|
Buderim |
42,239 |
50.8% |
74% |
14% |
12% |
|
Camp Hill |
29,439 |
50.4% |
65% |
22% |
13% |
|
Helensvale |
29,420 |
51.2% |
68% |
22% |
10% |
|
Coorparoo |
28,766 |
49.9% |
67% |
21% |
12% |
|
Southport |
26,838 |
49.8% |
56% |
22% |
22% |
|
Hope Island |
26,386 |
81.3% |
80% |
8% |
12% |
|
Upper Coomera |
25,840 |
41.9% |
55% |
33% |
12% |
|
Robina |
25,544 |
49.5% |
67% |
21% |
12% |
|
Broadbeach Waters |
25,510 |
51.0% |
76% |
6% |
18% |
|
Coomera |
25,236 |
61.3% |
50% |
35% |
15% |
Source: Realestate.com.au
|
Units |
|||||
|---|---|---|---|---|---|
|
Suburb |
Highly engaged buyers |
YoY growth |
Buyer type |
||
|
Subsequent buyers |
First home buyers |
Investors |
|||
|
Surfers Paradise |
40,938 |
60.6% |
48% |
13% |
39% |
|
Southport |
21,333 |
39.1% |
48% |
25% |
27% |
|
Broadbeach |
19,332 |
55.9% |
54% |
11% |
35% |
|
Maroochydore |
19,209 |
66.0% |
50% |
18% |
32% |
|
Palm Beach |
19,047 |
44.4% |
50% |
23% |
28% |
|
Brisbane City |
18,313 |
18.7% |
47% |
23% |
30% |
|
Burleigh Heads |
17,428 |
53.1% |
54% |
16% |
30% |
|
New Farm |
16,798 |
24.0% |
54% |
26% |
20% |
|
Mooloolaba |
16,023 |
40.3% |
43% |
10% |
47% |
|
Kangaroo Point |
15,448 |
33.0% |
50% |
29% |
21% |
Source: Realestate.com.au
Western Australia
|
Houses |
|||||
|---|---|---|---|---|---|
|
Suburb |
Highly engaged buyers |
YoY growth |
Buyer type |
||
|
Subsequent buyers |
First home buyers |
Investors |
|||
|
Scarborough |
15,797 |
49.7% |
55% |
34% |
10% |
|
Dianella |
14,926 |
32.3% |
56% |
36% |
8% |
|
Baldivis |
14,647 |
60.2% |
54% |
38% |
8% |
|
Duncraig |
14,229 |
36.7% |
64% |
30% |
6% |
|
Canning Vale |
13,743 |
43.4% |
48% |
45% |
7% |
|
Bayswater |
13,673 |
23.6% |
48% |
44% |
8% |
|
Mount Lawley |
13,364 |
21.4% |
68% |
23% |
9% |
|
North Perth |
13,289 |
32.7% |
70% |
20% |
10% |
|
Hillarys |
12,622 |
43.8% |
72% |
19% |
9% |
|
Fremantle |
12,603 |
38.9% |
68% |
22% |
10% |
Source: Realestate.com.au
|
Units |
|||||
|---|---|---|---|---|---|
|
Suburb |
Highly engaged buyers |
YoY growth |
Buyer type |
||
|
Subsequent buyers |
First home buyers |
Investors |
|||
|
Scarborough |
13,268 |
40.7% |
42% |
41% |
17% |
|
Perth |
11,790 |
46.1% |
43% |
34% |
23% |
|
East Perth |
10,050 |
35.9% |
42% |
35% |
23% |
|
South Perth |
9,763 |
33.6% |
56% |
24% |
30% |
|
West Perth |
9,325 |
60.0% |
44% |
34% |
22% |
|
Como |
9,029 |
46.3% |
40% |
43% |
17% |
|
Fremantle |
8,039 |
64.8% |
45% |
36% |
19% |
|
Maylands |
8,033 |
20.5% |
35% |
45% |
20% |
|
Mount Lawley |
7,419 |
33.1% |
36% |
45% |
19% |
|
Wembley |
6,922 |
65.4% |
34% |
40% |
26% |
Source: Realestate.com.au
South Australia
|
Houses |
|||||
|---|---|---|---|---|---|
|
Suburb |
Highly engaged buyers |
YoY growth |
Buyer type |
||
|
Subsequent buyers |
First home buyers |
Investors |
|||
|
Prospect |
19,226 |
39.4% |
59% |
25% |
16% |
|
Hallet Cove |
16,703 |
38.4% |
53% |
37% |
10% |
|
Norwood |
16,517 |
53.7% |
71% |
13% |
15% |
|
Morphett Vale |
16,429 |
47.6% |
38% |
48% |
14% |
|
Magill |
16,000 |
13.9% |
55% |
33% |
12% |
|
Mount Barker |
15,814 |
32.5% |
58% |
32% |
10% |
|
Happy Valley |
15,410 |
34.3% |
44% |
47% |
9% |
|
Golden Grove |
15,248 |
24.1% |
65% |
25% |
10% |
|
Belair |
15,022 |
34.3% |
72% |
23% |
5% |
|
Flagstaff Hill |
14,432 |
27.7% |
56% |
37% |
7% |
Source: Realestate.com.au
|
Units |
|||||
|---|---|---|---|---|---|
|
Suburb |
Highly engaged buyers |
YoY growth |
Buyer type |
||
|
Subsequent buyers |
First home buyers |
Investors |
|||
|
Adelaide |
20,427 |
26.2% |
42% |
22% |
36% |
|
Glenelg |
7,698 |
24.5% |
54% |
9% |
37% |
|
Norwood |
7,637 |
13.4% |
45% |
28% |
26% |
|
Glenelg North |
6,172 |
14.9% |
44% |
17% |
39% |
|
North Adelaide |
5,674 |
1.8% |
49% |
21% |
30% |
|
Prospect |
5,655 |
49.4% |
30% |
48% |
22% |
|
Plympton |
5,387 |
54.2% |
30% |
49% |
21% |
|
Glenelg East |
5,359 |
75.9% |
46% |
21% |
23% |
|
Somerton Park |
5,154 |
70.4% |
54% |
21% |
24% |
|
Magill |
4,847 |
33.2% |
39% |
36% |
24% |
Source: Realestate.com.au
Tasmania
|
Houses |
|||||
|---|---|---|---|---|---|
|
Suburb |
Highly engaged buyers |
YoY growth |
Buyer type |
||
|
Subsequent buyers |
First home buyers |
Investors |
|||
|
Sandy Bay |
13,526 |
20.6% |
68% |
10% |
22% |
|
Kingston |
11,796 |
23.6% |
50% |
35% |
15% |
|
Howrah |
10,758 |
10.9% |
52% |
36% |
12% |
|
Lindisfarne |
10,686 |
27.9% |
55% |
30% |
15% |
|
Devonport |
10,269 |
21.1% |
47% |
31% |
22% |
|
Claremont |
9,476 |
42.5% |
40% |
44% |
16% |
|
West Launceston |
9,158 |
32.8% |
52% |
23% |
25% |
|
West Hobart |
8,843 |
8.2% |
63% |
19% |
18% |
|
Glenorchy |
8,837 |
2.1% |
33% |
44% |
23% |
|
South Launceston |
8,615 |
19.4% |
45% |
27% |
28% |
Source: Realestate.com.au
|
Units |
|||||
|---|---|---|---|---|---|
|
Suburb |
Highly engaged buyers |
YoY growth |
Buyer type |
||
|
Subsequent buyers |
First home buyers |
Investors |
|||
|
Sandy Bay |
5,242 |
-3.4% |
46% |
21% |
33% |
|
Kingston |
4,027 |
42.4% |
39% |
44% |
17% |
|
Bellerive |
3,621 |
63.1% |
43% |
34% |
23% |
|
Hobart |
3,592 |
18.2% |
43% |
17% |
41% |
|
Claremont |
3,501 |
83.8% |
36% |
43% |
21% |
|
Howrah |
3,430 |
45.6% |
35% |
46% |
19% |
|
Blackmans Bay |
3,237 |
76.0% |
40% |
39% |
21% |
|
Glenorchy |
2,811 |
-11.1% |
31% |
35% |
34% |
|
Launceston |
2,183 |
-10.0% |
32% |
9% |
59% |
|
Devonport |
2,033 |
41.6% |
44% |
21% |
35% |
Source: Realestate.com.au
Northern Territory
|
Houses |
|||||
|---|---|---|---|---|---|
|
Suburb |
Highly engaged buyers |
YoY growth |
Buyer type |
||
|
Subsequent buyers |
First home buyers |
Investors |
|||
|
Leanyer |
4,231 |
46.6% |
40% |
55% |
5% |
|
Humpty Doo |
3,797 |
89.9% |
59% |
37% |
4% |
|
Durack |
3,652 |
53.3% |
44% |
51% |
6% |
|
Howard Springs |
3,239 |
49.1% |
64% |
29% |
7% |
|
Muirhead |
3,024 |
99.9% |
34% |
55% |
11% |
|
Rosebery |
2,995 |
37.7% |
42% |
52% |
6% |
|
Stuart Park |
2,896 |
59.0% |
59% |
32% |
9% |
|
Wulagi |
2,819 |
51.9% |
36% |
57% |
7% |
|
Woodroffe |
2,655 |
84.5% |
36% |
55% |
9% |
|
Gunn |
2,648 |
9.9% |
42% |
53% |
5% |
Source: Realestate.com.au
|
Units |
|||||
|---|---|---|---|---|---|
|
Suburb |
Highly engaged buyers |
YoY growth |
Buyer type |
||
|
Subsequent buyers |
First home buyers |
Investors |
|||
|
Darwin City |
5,115 |
67.5% |
41% |
34% |
25% |
|
Stuart Park |
3,114 |
60.4% |
41% |
47% |
12% |
|
Larrakeyah |
2,826 |
43.3% |
56% |
24% |
30% |
|
Nightcliff |
2,398 |
80.6% |
39% |
49% |
12% |
|
Fannie Bay |
1,965 |
97.3% |
41% |
45% |
14% |
|
Parap |
1,634 |
83.8% |
46% |
36% |
18% |
|
Coconut Grove |
1,460 |
21.7% |
33% |
51% |
16% |
|
Rapid Creek |
1,417 |
38.8% |
39% |
38% |
23% |
|
Bayview |
1,381 |
67.0% |
42% |
46% |
12% |
|
Johnston |
1,207 |
94.7% |
24% |
63% |
14% |
Source: Realestate.com.au
Australian Capital Territory
|
Houses |
|||||
|---|---|---|---|---|---|
|
Suburb |
Highly engaged buyers |
YoY growth |
Buyer type |
||
|
Subsequent buyers |
First home buyers |
Investors |
|||
|
Kambah |
6,433 |
122.1% |
46% |
41% |
10% |
|
Ngunnawal |
5,415 |
104.5% |
37% |
55% |
8% |
|
Wanniassa |
4,142 |
99.7% |
44% |
46% |
10% |
|
Bonner |
3,802 |
69.2% |
39% |
54% |
6% |
|
Macgregor |
3,687 |
75.8% |
34% |
59% |
7% |
|
Evatt |
3,596 |
153.8% |
47% |
44% |
9% |
|
Watson |
3,449 |
152.3% |
52% |
40% |
8% |
|
Gordon |
3,397 |
100.9% |
49% |
45% |
6% |
|
Calwell |
3,330 |
103.7% |
46% |
47% |
7% |
|
Holt |
3,130 |
104.2% |
34% |
58% |
8% |
Source: Realestate.com.au
|
Units |
|||||
|---|---|---|---|---|---|
|
Suburb |
Highly engaged buyers |
YoY growth |
Buyer type |
||
|
Subsequent buyers |
First home buyers |
Investors |
|||
|
Kingston |
4,261 |
92.1% |
46% |
24% |
20% |
|
Braddon |
4,154 |
76.2% |
39% |
42% |
19% |
|
Bruce |
4,042 |
89.7% |
35% |
48% |
17% |
|
Belconnen |
3,845 |
87.9% |
33% |
45% |
22% |
|
Griffith |
3,472 |
121.3% |
42% |
35% |
23% |
|
Turner |
3,412 |
95.4% |
39% |
41% |
30% |
|
Lyneham |
3,062 |
96.7% |
34% |
49% |
17% |
|
Phillip |
3,061 |
127.8% |
35% |
49% |
16% |
|
Harrison |
2,569 |
103.9% |
30% |
55% |
15% |
|
Franklin |
2,522 |
75.1% |
24% |
54% |
22% |
Source: Realestate.com.au