Australia’s housing market growth is slowing, and our Top 100 are not immune.
After five years of successive increases, this year saw a 5% decrease in the combined value of settlements by the Top 100, to a not-insubstantial $10,148,131,878. However, this year’s No.1 broker set a new record with a staggering settlement total of $335,973,416.
Numbers this year took a dip in terms of the combined value of settlements and the individual total required to make the Top 100, down from $70.7m to $64.8m this year. Is 2016 merely a bump in the road, or the beginning of a decline for Australia’s elite brokers?
One huge short-term factor must be considered. Earlier this year banks cracked down on lending to borrowers with foreign incomes or based abroad. Evidently this hit some brokers hard; indeed five of our Top 10 brokers in 2015 didn’t even make it into this year’s overall Top 100. Note, however, that lending to foreign investors has not ceased altogether, and there are Top 100 brokers who still work in this space. What had an impact was the speed of changes made by the banks, often overnight, catching out brokers. Foreign investor-focused brokers may well recover, even if that market never gets back to its previous strength.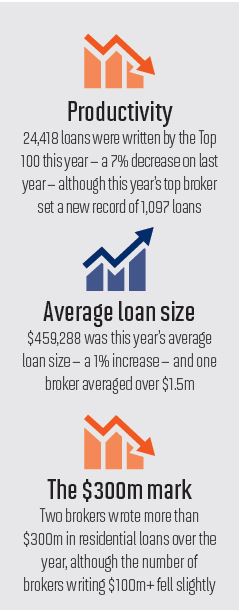
APRA’s changes, on the other hand, seem to have had quite a different impact on elite brokers. Many investors, frustrated at being unable to get finance from their banks or brokers, have gone looking for investor specialists, a group that includes this year’s top broker.
Other investors, sensing opportunity, have decided now is the time to buy, with a little help from their brokers. Less positively, many brokers told MPA that APRA’s changes had increased the work required on each loan, with repercussions for profitability and brokerage structure.
Australia’s housing market growth is slowing, and our Top 100 are not immune. The average loan size written by this year’s Top 100 broker has barely increased, by just 1% – a figure that reflects the mixed fortunes of Australia’s housing markets. Looking at CoreLogic’s Home Value Indices, we find that the year-on-year rate of growth fell in Sydney from 18% in July 2015 to 9% in July 2016, and in Melbourne from 11% to 7.5%; prices fell even faster in Perth, accelerating from -0.3% to -5.6%.
Slowing growth does not equate to a decline, and so while there’s still growth we’d expect to see the Top 100’s numbers increase next year. That assumes, of course, no further bank lending restrictions – not to mention changes to broker commissions – but with increasing concerns over apartment oversupply in capital cities, next year’s Top 100 look unlikely to have a smooth run.